WHAT IS DATA TRANSMISSION?
source:
Source is
where the data is originated. Typically it is a computer, but it can be any
other electronic equipment such as telephone handset, video camera, etc, which
can generate data for transmission to some destination. The data to be sent is
represented by x(t).
 |
| source |
Transmitter:
As data cannot be sent in its native form, it is
necessary to convert it into signal. This is performed with the help of a
transmitter such as modem. The signal that is sent by the transmitter is
represented by s(t).
Communication Medium:
The signal can be sent to the
receiver through a communication medium, which could be a simple twisted-pair
of wire, a coaxial cable, optical fiber or wireless communication system. It
may be noted that the signal that comes out of the communication medium is
s’(t), which is different from s(t) that was sent by the transmitter. This is
due to various impairments that the signal suffers as it passes through the
communication medium.
Receiver:
The receiver receives the signal s’(t) and converts
it back to data d’(t) before forwarding to the destination. The data that the
destination receives may not be identical to that of d(t), because of the
corruption of data.
People also ask by GOOGLE
Destination:
Destination is where the data is absorbed. Again, it
can be a computer system, a telephone handset, a television set and so on.
Data:
Data refers to information that conveys some meaning
based on some mutually agreed up rules or conventions between a sender and a
receiver and today it comes in a variety of forms such as text, graphics,
audio, video and animation.
Data can be of two types;
Analog data: take on continuous
values on some interval. Typical examples of analog data are voice and video.
The data that are collected from the real world with the help of transducers
are continuous-valued or analog in nature.
digital data: take on discrete values.
Text or character strings can be considered as examples of digital data.
Characters are represented by suitable codes, e.g. ASCII code, where each
character is represented by a 7-bit code.
Signal:
It is electrical, electronic or optical
representation of data, which can be sent over a communication medium. Stated
in mathematical terms, a signal is merely a function of the data.
 |
| signal |
Digital signal can have only a
limited number of defined values, usually two values 0 and 1
 |
| digital signle |
Signaling:
It is an act of sending signal over communication medium
Transmission: Communication of data by propagation and processing is
known as transmission.
Time-domain concepts
A signal is continuous over
a period, if
limt->a s (t) = s
(a), for all a,
i.e., there is no
break in the signal. A signal is discrete if it takes on only a finite
number of values. A signal is periodic if and only if
s (t+T) = s (t) for -
α < t < α ,
where
T is a constant, known as period. The period is measured in seconds.
In other words, a signal is a periodic
signal if it completes a pattern within a measurable time frame. A periodic
signal is characterized by the following three parameters
Amplitude:
It
is the value of the signal at different instants of time. It is measured in
volts.
Frequency:
It
is inverse of the time period, i.e. f = 1/T. The unit of frequency is Hertz
(Hz) or cycles per second.
People also ask by GOOGLE
Phase:
It gives a
measure of the relative position in time of two signals within a single period.
It is represented by φ in degrees or radian.
A
sine wave, the most fundamental periodic signal, can be completely
characterized by its amplitude, frequency and phase. Examples of sine waves
with different amplitude, frequency and phase are shown in Fig The phase angle
φ indicated in the figure is with respect to the reference waveform shown in
Fig
 |
| time domain |
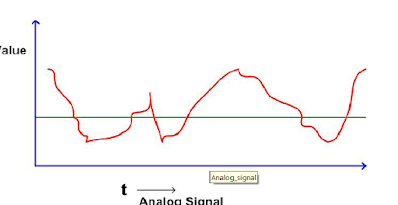
An aperiodic signal or nonperiodic signal changes constantly without exhibiting a pattern or cycle that repeats over time as shown
 |
| time domain |
People also ask by GOOGLE
Frequency domain concepts
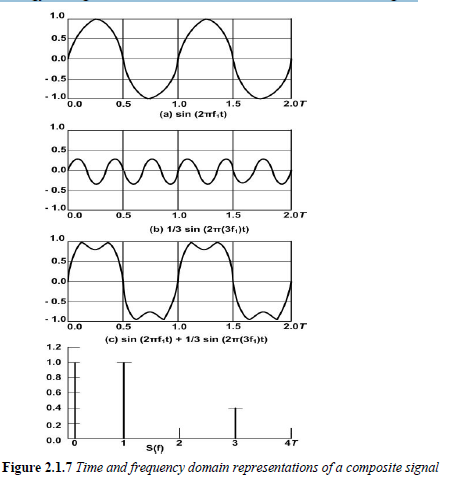
The time domain representation displays a signal using time-domain plot, which shows changes in signal amplitude with time. The time-domain plot can be visualized with the help of an oscilloscope. The relationship between amplitude and frequency is provided by frequency domain representation, which can be displayed with the help of spectrum analyser. Time domain and frequency domain representations of three sine waves of three different frequencies are shown in Fig
 |
| frequency domain |


إرسال تعليق
have you a any doubt then tell and if you want some topic then please tell .